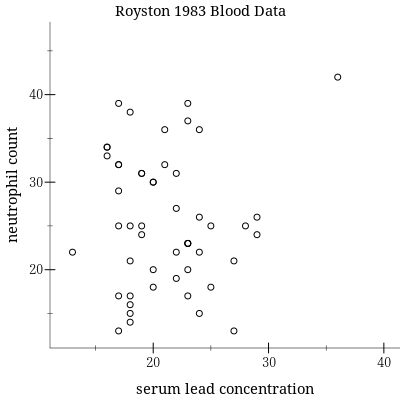
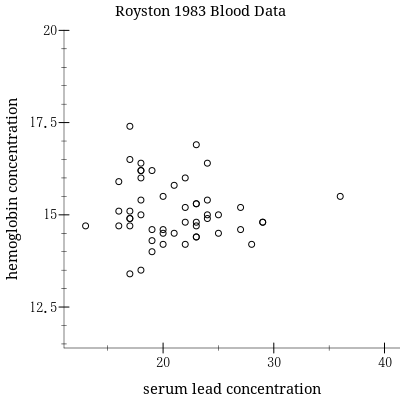
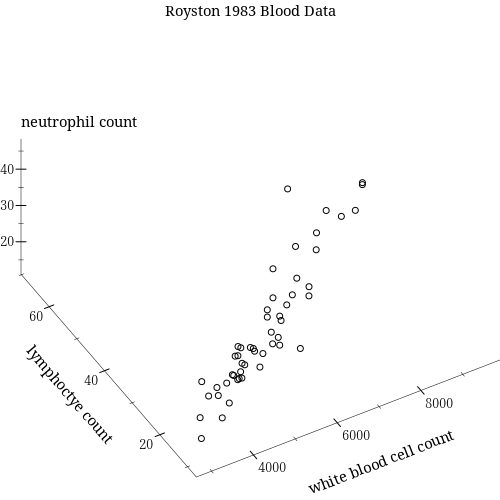
I've been sitting in on a statistics class but wasn't able to take the quiz with the students. The class is usually in the morning but the quiz was during a make-up class in the evening. The chickens need attention in the evenings at this time of year, it's a race to get them fed and in bed (on the roosting bar) before a feral cat starts taking them away.. The quiz worked with blood test data from 1983, a famous (?) data set from Royston.. I started making visualizations with Racket^1 and now I'm wondering what I'm looking at... Lead is dangerous!! like radiactivity, but the nuclear industry hasn't been put in their place the way the lead-using industries have, I guess.
Pre-industrial human BLL measurements are estimated to have been 0.016 μg/dL, and this level increased markedly in the aftermath of the industrial revolution. At the end of the late 20th century, BLL measurements from remote human populations ranged from 0.8 to 3.2 μg/dL. Children in populations adjacent to industrial centers in developing countries often have average BLL measurements above 25 μg/dL. In the United States, the average blood level for children aged 1–5 years fell from 15.2 μg/dL in 1976–1980 to 0.83 μg/dL in 2011–2016, a change largely attributed to phasing out leaded gasoline...
The Centers for Disease Control and Prevention (CDC) changed its view on blood lead levels in 2012[8] because of "a growing body of studies concluding that blood lead levels (BLLs) lower than 10 μg/dL harm children"[9] with "irreversible" effects, and "since no safe blood lead level in children has been identified, a blood lead 'level of concern' cannot be used to define individuals in need of intervention". The new policy is to aim to reduce average blood lead levels in US children to as low a level as possible.
I wish I had found this table of data before typing it all in from images:
And here's a general description of what to look for in blood work:
It looks like there's an outlier... I have to work on faceting with plot/pict instead of saving each plot to file... But this was a good start.. I had been hoping to see something more clear in one of the 3d plots... The only thing that looked promising was the three different measurements for white blood cells: in general, lymphocytes, and neutrophils. That taught me something: that I have to read about what these measurements mean.


#
BloodWork #
BLL #
BloodLeadLevels #
RoystonsStatistics #
StatisticsClass #
RacketPlot